Turn Scattered Data into Clear Decisions
Website, campaigns, sales, conversations with customers: every tool has its own numbers, and nobody has the time to put them together. AC Agency connects your data sources, checks that they measure the right things and builds dashboards that show what matters at a glance.
Why Data Analysis Matters
Without reliable data, every decision is a guess. With the right setup you can see:
- Which channels bring customers, not just visits
- How much each result really costs, campaign by campaign
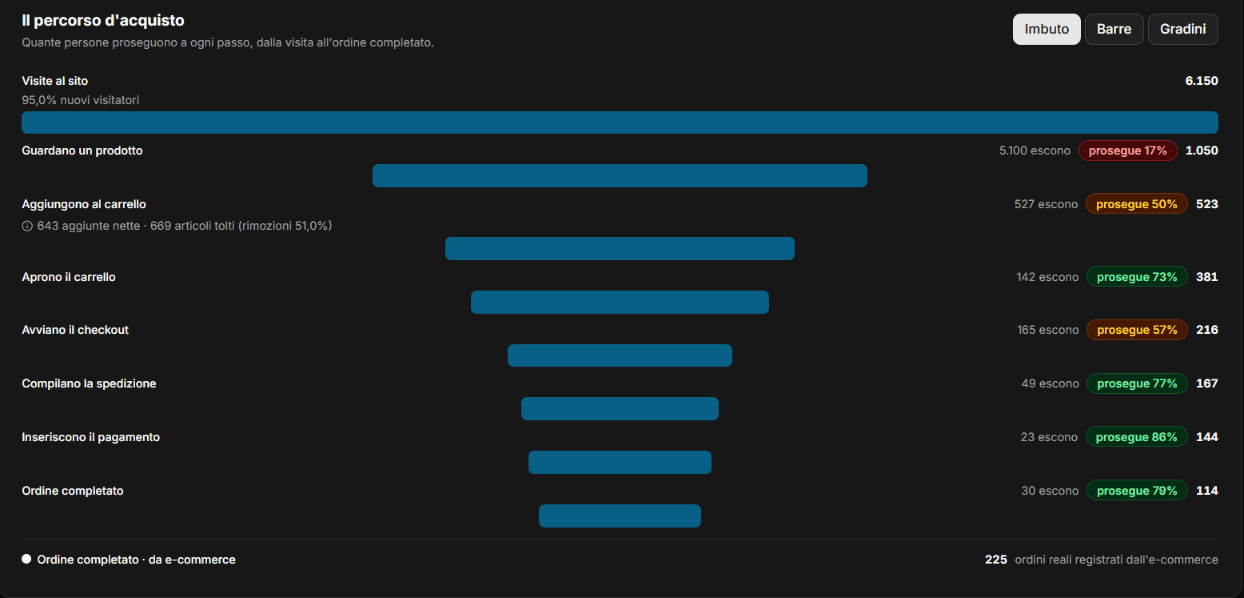
- Where visitors drop off before converting
- What customers ask and look for on your website
- How performance changes month after month
Our Data & Analytics Services
1. Tracking & Conversion Setup
The foundation of every analysis: data you can trust.
- Google Analytics 4 configuration
- Google Tag Manager implementation
- Conversion tracking on forms, purchases, calls and thank-you pages
- Event testing before going live
- Review of existing tracking
2. Looker Studio Dashboards
All your marketing data in a single view, updated automatically.
- Custom dashboards built around your goals
- Website, Google Ads, Meta Ads and LinkedIn Ads in one report
- Automatic data refresh, no manual exports
- Filters by period, channel and campaign
- Access for your whole team
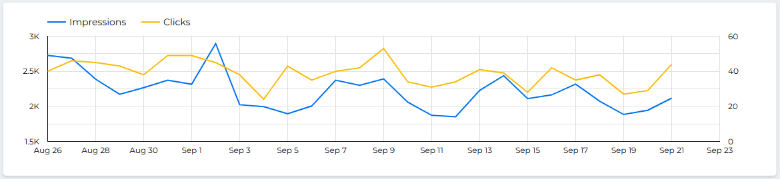
Daily search visibility and clicks, tracked automatically without manual exports.
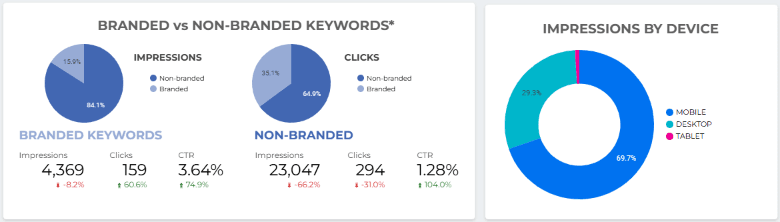
Where search traffic comes from: brand searches versus new customers, and which devices they use.
3. Business Intelligence with Chatterence
Chatterence BI brings your stats together in one dashboard, from advertising to sales to your web assistant.
- Unified dashboard across your data sources
- Analysis of conversations with the Chatterence web assistant
- Trends over time
4. Campaign Performance Analysis
Every campaign measured on the same scale.
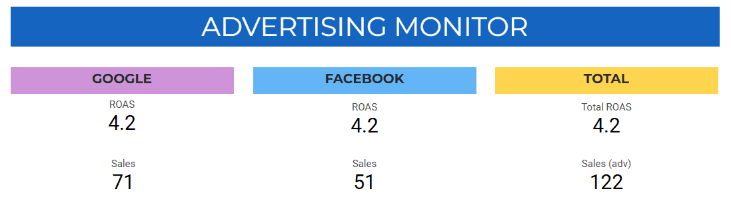
- Cost per conversion by channel
- Comparison between Google Ads, Meta Ads and LinkedIn Ads
- Performance of creatives and audiences
- Budget allocation recommendations
5. Periodic Reports & Insights
Numbers are only useful if someone reads them.
- Monthly reports on agreed KPIs
- Comments on what changed and why
- Priorities for the following month
Your Data Journey Starts Here
Ready to see your business clearly? We start with:
- A review of what you track today
- Missing tracking fixed and completed
- A dashboard built around your decisions
- Ongoing analysis with clear priorities
AC Agency: Revealing Your Digital Potential